
Marketing & Collateral Design
Marketing & Collateral Design
At Chillibreeze, creativity meets purpose. Our suite of creative services is designed to visually elevate your brand and communicate your message with clarity and impact. Whether you're looking to craft a compelling logo, bring stories to life through motion graphics, or simplify complex ideas with infographics, we’ve got you covered.
At Chillibreeze, creativity meets purpose. Our suite of creative services is designed to visually elevate your brand and communicate your message with clarity and impact. Whether you're looking to craft a compelling logo, bring stories to life through motion graphics, or simplify complex ideas with infographics, we’ve got you covered.
Browse Through Our Marketing & Collateral Design
Marketing & Collateral Design Services at Chillibreeze birthed out of a customer’s need and the Chillibreeze team’s readiness to dive into the challenge headon.
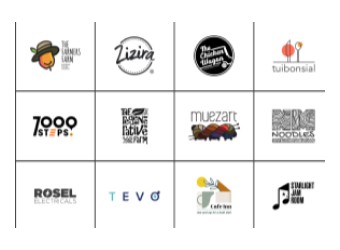
Logo Design
Your logo visually communicates what your brand and business are all about.
Logo Design
Your logo visually communicates what your brand and business are all about.
Logo Design
Your logo visually communicates what your brand and business are all about.
Logo Design
Your logo visually communicates what your brand and business are all about.
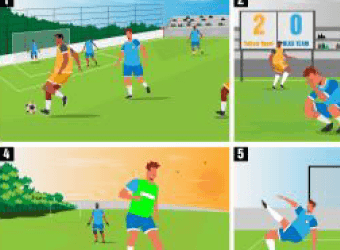
Storytelling Design
Creatively promote your brand through inspiring visual
Storytelling Design
Creatively promote your brand through inspiring visual
Storytelling Design
Creatively promote your brand through inspiring visual
Graphic Illustration
Great presentations are made from great visuals
Graphic Illustration
Great presentations are made from great visuals
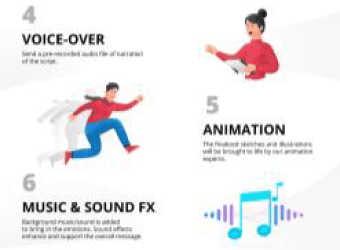
Infographic Design
The primary use of Infographic Design is when it comes to sharing statistics.
Infographic Design
The primary use of Infographic Design is when it comes to sharing statistics.
Icon Creation
An awesome icon can take your presentation to the next level
Icon Creation
An awesome icon can take your presentation to the next level
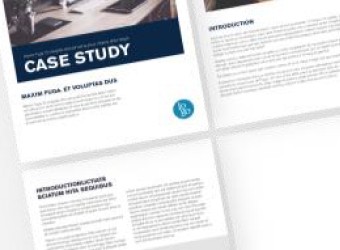
White Papers
Your logo visually communicates what your brand and business are all about.
White Papers
Your logo visually communicates what your brand and business are all about.
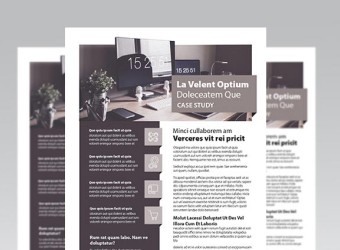
Book Layout
Make it a brand guide, company culture book, HR policy tutorial,
Book Layout
Make it a brand guide, company culture book, HR policy tutorial,
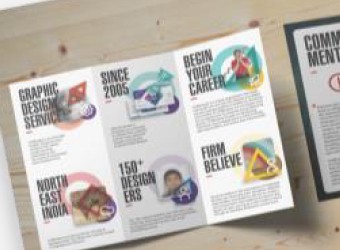
Banner & Brochures
Banners, Brochures and Posters are a marketing professional’s best
Banner & Brochures
Banners, Brochures and Posters are a marketing professional’s best
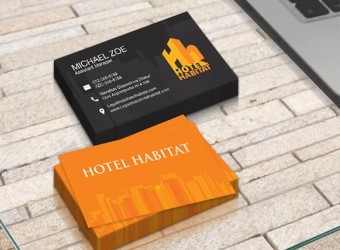
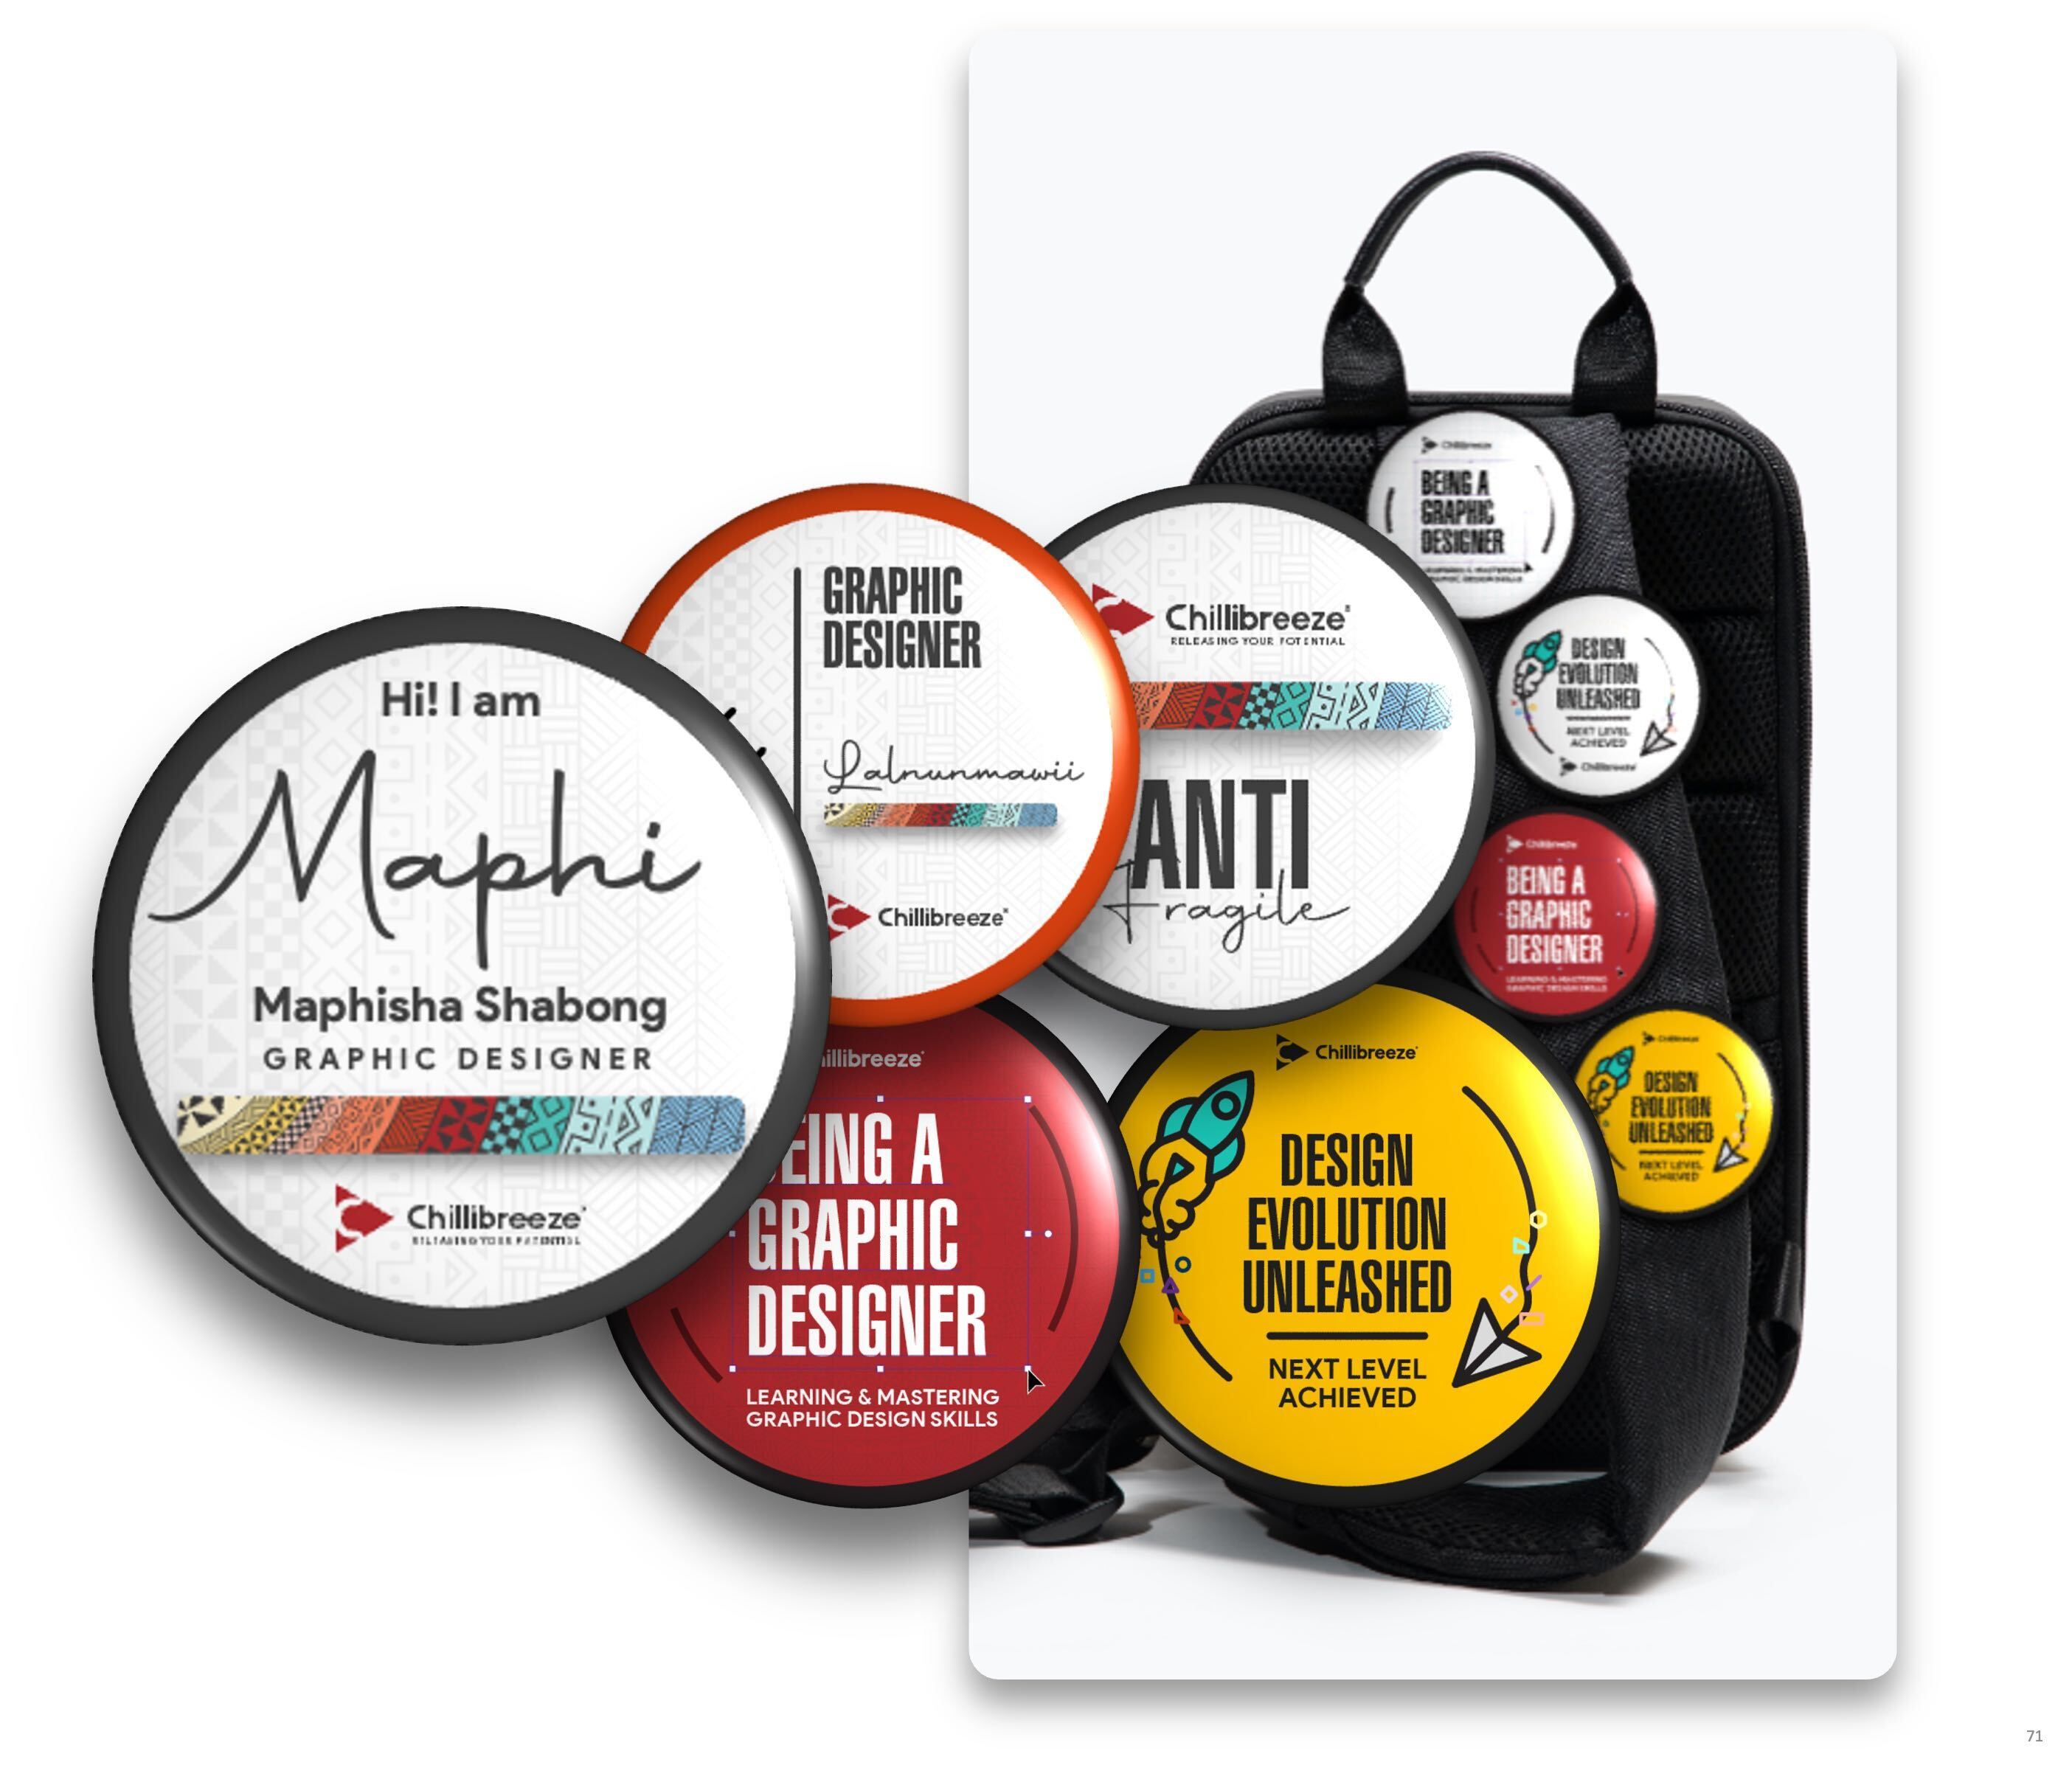
Business Card
Increasing customer awareness about your business and offering requires branding of all materials
Business Card
Increasing customer awareness about your business and offering requires branding of all materials
We also design other MS Office Apps such as Word, Excel, Flowcharts
We also design other MS Office Apps such as Word, Excel, Flowcharts


SEARCHING FOR MORE DESIGN SOLUTIONS?
Elevate Your Visual Needs With Our Alternative Services
Elevate Your Visual Needs With Our Alternative Services


SharePoint Workspace Design
Elevate Your Visual Needs With Our Alternative Services
SharePoint Workspace Design
Elevate Your Visual Needs With Our Alternative Services
SharePoint Workspace Design
Elevate Your Visual Needs With Our Alternative Services

Ready to begin?
Learn how our proven process helps you start quickly and confidently.
Ready to begin?
Learn how our proven process helps you start quickly and confidently.
Ready to begin?
Learn how our proven process helps you start quickly and confidently.

Frequently asked questions
What Marketing & Collateral Design services does Chillibreeze offer?
Can you design Banners, Brochures, and Posters for my marketing needs?
How do I get started with Marketing & Collateral Design services?
What is the typical turnaround time for Marketing & Collateral projects?
How do you handle data security for my marketing materials?